
Huisman launches new Performance Insights application
“Keep your equipment running smoothly with performance monitoring and predictive maintenance, increasing uptime and reducing costs.”
As the offshore wind industry continues to grow at a rapid rate worldwide, reliability and predictability are key. One way to maximise uptime and the operational efficiency of our clients’ equipment is by gaining insight into its status and operational needs. To support clients and optimise their operational processes, Huisman has launched its latest innovation in data-driven services, Performance Insights.
Live from 20 February, the new Performance Insights Application is available through the client portal myHuisman©. Performance Insights allows clients to predict the maintenance needs of their equipment and components, thereby improving equipment availability and enhancing decision-making. In its final stage, the Performance Insights app will provide comprehensive monitoring through five dashboards, covering historical usage, real-time conditions, and predictive system analytics.
Data-driven insights for optimal equipment performance
The application visualises data to monitor, evaluate, and predict equipment performance and maintenance, using both data and historical analysis. Clients can monitor the performance and status of their equipment, which paves the way for predictive maintenance that, in turn, maximises uptime and saves costs.
By analysing collected data, clients have a comprehensive overview. Theoretical design life models are compared with historical usage data, offering insights into component wear, operator usage, and equipment energy efficiency. The benefits include the possibility of postponing inspections, which may not be necessary at that point in time. Clients can be confident that their equipment is still being serviced regularly and remains in top condition.
Improvement sessions and advice
Supporting its clients to gain the most from their data, Huisman can identify defects and track the actions taken before and after their occurrence, providing both our team and our clients with detailed insights to prevent future issues. An improvement report is prepared and reviewed with the client during dedicated sessions to ensure alignment and actionable results.
Five dashboards
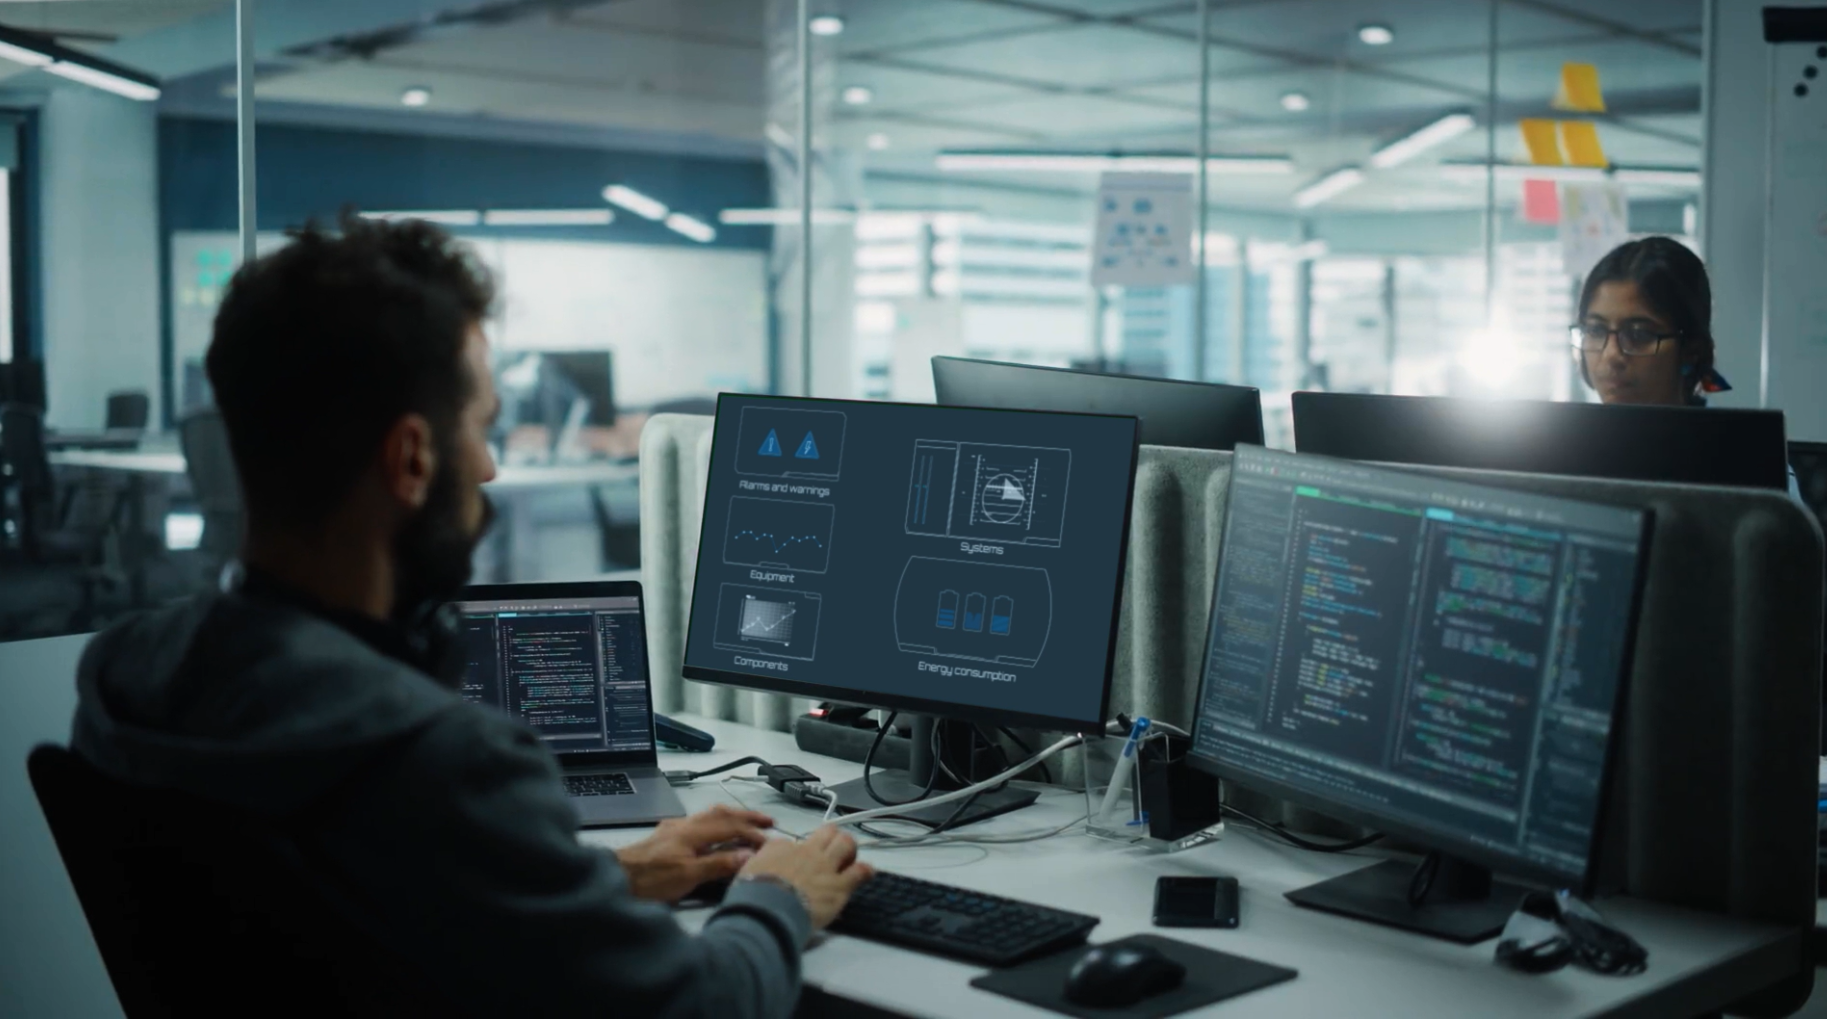
“The Performance Insights app will feature a total of five dashboards: Equipment, Alarms and Warnings, Energy Consumption, Components and Systems. The first four dashboards are now live and operational. These first dashboards are focused on usage monitoring. Historical data gives insight on how the equipment is handled. In the next phase we will focus on the actual (condition) monitoring and future status (system analytics) of equipment”, says Dirk-Jan Goudswaard, Manager Digital Operations.
Equipment dashboard
Boost efficiency and productivity with the Equipment dashboard, which grants insights into your equipment’s performance and functionality. Features include a range of critical parameters and metrics; the number of lifts and loads, the slew angle and hook position, and the equipment/component’s theoretical lifetime.
The usage data provides valuable insights that form the basis for strategic decisions, but it also reveals interactions with the system, highlighting areas for improvement.
Alarms and Warnings dashboard
The Alarms and Warnings dashboard provides valuable information on equipment’s operations. Analysis of event patterns facilitates proactive management and swift resolution. This enhanced visibility ensures troubleshooting and fault finding can be performed more efficiently.
Key features include timing, frequency, and the occurrence of specific events. Alarms and Warnings are categorised and can be filtered and sorted.
Energy Consumption dashboard
The Energy Consumption dashboard app provides a clear and comprehensive overview of your equipment’s energy consumption, enabling the implementation of effective energy-saving measures. Insights into peak usage times, standby consumption and energy trends lead to identification of inefficiencies. Anomalies are identified, ultimately leading to improved operational reliability.
Key features include a clear and in-depth overview on the energy balance for improvement, the usage of electrical feeds, main consumers etc. Used energy and generated energy per equipment and system is shown and it provides statistics of the energy consumed over a longer period of time.
Components dashboard
The Components dashboard uncovers details of usage for critical items. Monitor usage patterns of components such as the gearbox, e-motor, brake, and wire rope. These key insights help extend the lifespan of critical components significantly improving reliability of the overall equipment.
Key features include an overview of core components per system. Data on running hours, revolutions, use of design duty are shown per component. Information is available on performed brake tests and it’s results.
As of February, Usage monitoring is available through a subscription model. The subscription grants unlimited access to the four usage dashboards (Equipment, Alarms and Warnings, Energy Consumption and Components) for users.
In the coming period, Huisman will focus on developing advanced condition monitoring and system analytics capabilities. This strategic initiative aims to support clients throughout the entire lifecycle of their equipment, ensuring optimal performance, reliability, and longevity. By leveraging these innovations, we strive to deliver comprehensive solutions that meet our clients’ evolving needs.
For further information about the Performance Insights App or subscription models, please contact your dedicated Account Manager or servicesales@huisman-nl.com.
Watch the video.